ELECTRONIC PRINCIPLES - OD1647 - LESSON 1/TASK 1
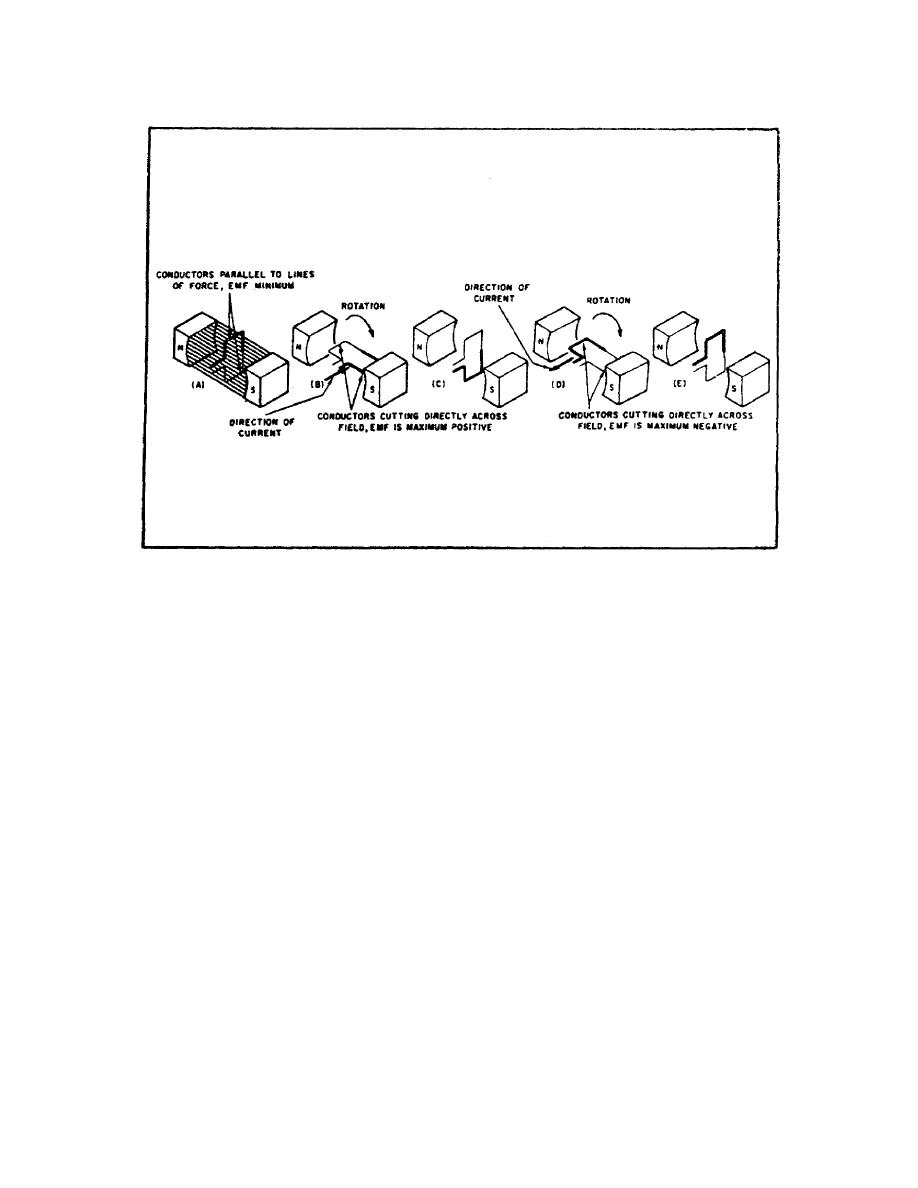
FIGURE 58. SIMPLE ALTERNATINGCURRENT GENERATOR.
cutting directly across the field, the voltage induced in the
conductor is maximum. If the rotation from figure 59, view A
and view B, on the following page, is plotted on a graph (and
the points connected), a curve will start to appear.
As the loop continues to be rotated toward the position shown in
figure 59, view C, it cuts fewer and fewer lines of force. The
induced voltage decreases from its peak value. Eventually, the
loop is moving in a plane parallel to the magnetic field, and no
emf is induced in the conductor.
The loop has now been rotated through half a circle (one
alternation or 180). If the preceding quartercycle is
plotted, it appears as shown in figure 59 (one alternation or 0
180).
When the same procedure is applied to the second half of
rotation (180 through 360), the curve appears as shown in
figure 59. Notice that the only difference is the polarity of
the induced voltage. Where previously the polarity was
positive, it is now negative. The sine curve shows
86


 Previous Page
