ELECTRONIC PRINCIPLES - OD1647 - LESSON 1/TASK 1
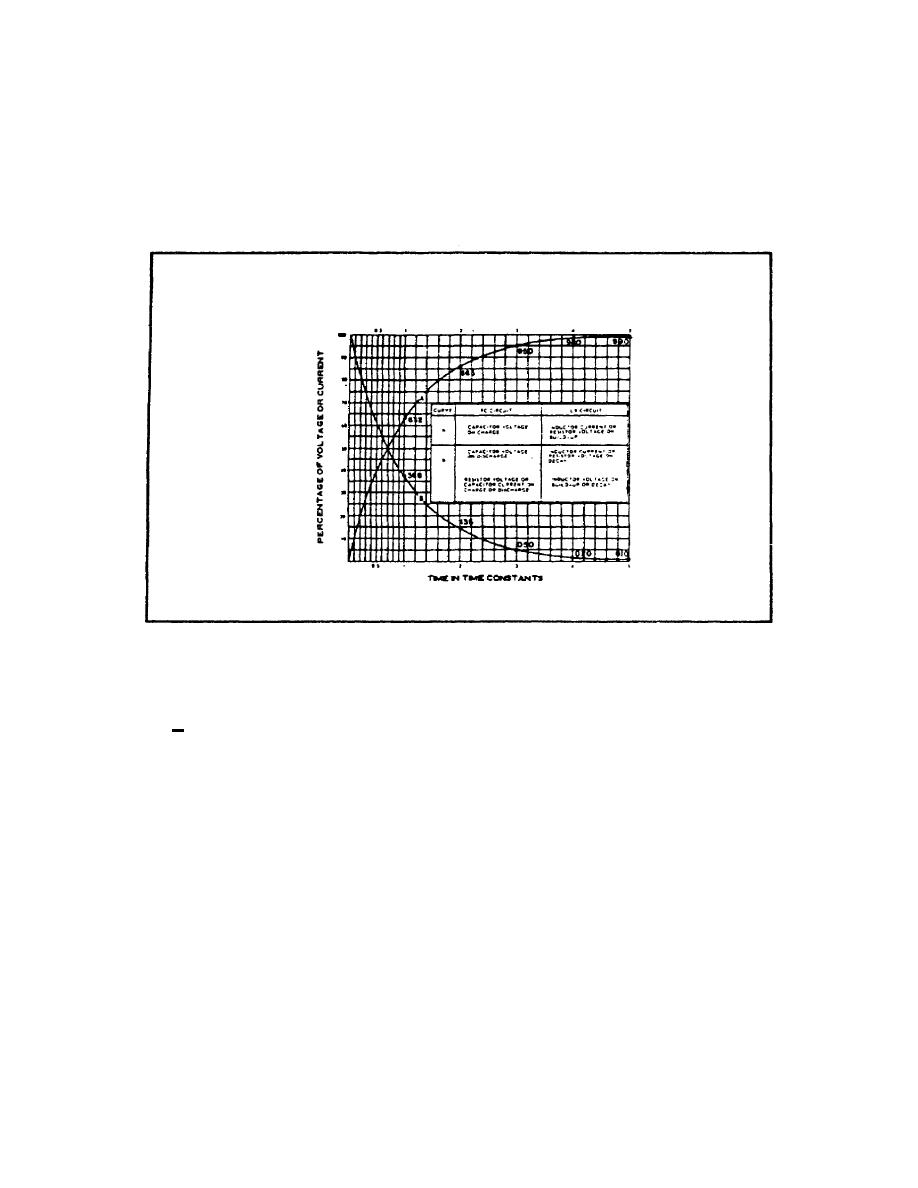
circuit. Curve A is a plot of both capacitor voltage during
charge and inductor current. during growth. Curve B is a plot
of both capacitor voltage during discharge and inductor current
during decay.
FIGURE 37. UNIVERSAL TIME CONSTANT CHART FOR RC AND RL
CIRCUITS.
The time scale (horizontal scale) is graduated in terms of the
RC or L time constants so that the curves may be used for any
R
value of R and C or I, and R. The voltage and current scales
(vertical scales) are graduated in terms of percentage of
maximum voltage or current so that the curves may be used for
any value of voltage or current. If the time constant and the
initial or final voltage for the circuit in question are known,
the voltages across, the various parts of the circuit can be
obtained from the curves for any time after the switch is
closed, either on charge or discharge. The same reasoning is
true for the current: in the circuit.
The following problem illustrates how the universal time
constant chart may be used.
58


 Previous Page
